Putting Applications to Production
After you published your applications as Docker images on DockerHub, you can deploy it into any cloud platform that supports container. Today almost all popular cloud platform supports Kubernetes and Docker, such as OpenShift, Microsoft Azure, etc.
Running a local Kubernetes cluster
There are a few means to get Kubernetes running in your local system, such as Docker Desktop for Windows/MacOS, minkube, and Minishift(an OpenShift upstream project).
For Windows user, the simplest approach could be installing a copy of Docker Desktop for Windows.
Docker Desktop
If you are using Docker Desktop for Windows or Docker Desktop for MacOS, there is no need to install an extra Kubernetes, it ships with a copy of Kubernetes.
To enable Kubernetes support in Docker Desktop for Windows, right click the Docker icon in the system tray, and open Settings from the context menu.
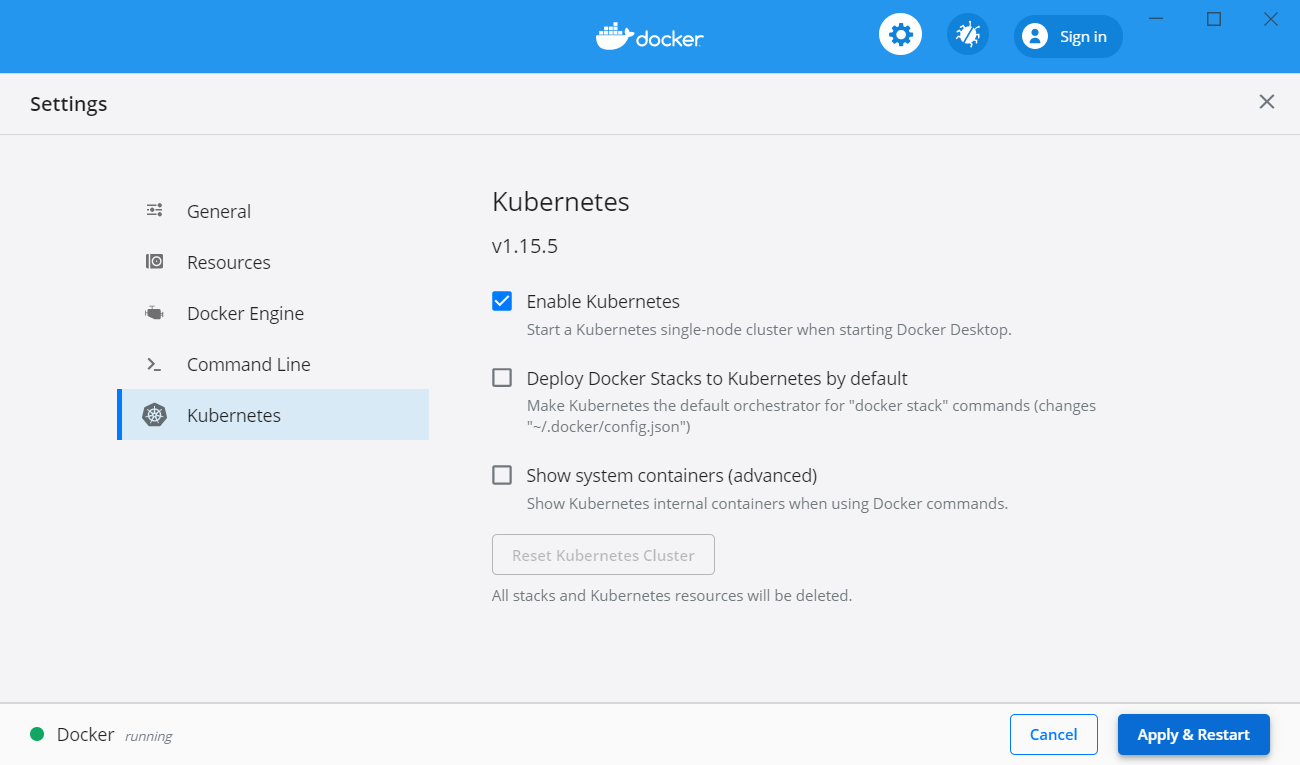
Select Kubernetes option in the left menu panel, in the right content panel, make sure the Enable Kubernetes is checked, and click Apply & Restart button.
Waiting for a while, it should start a local Kubernetes cluster.
For Chinese users, please follow the guide of AliyunContainerService/k8s-for-dociker-desktop to enable Kubernetes in your Docker Desktop.
There are couples of issues about enabling K8S in Docker Desktop for Windows, check Github Issues of docker/for-win.
Docker Desktop does not install Kubernetes Dashboard by default. You have to install it yourself.
$ kubectl apply -f https://raw.githubusercontent.com/kubernetes/dashboard/v2.0.0-rc5/aio/deploy/recommended.yaml
Check the pod status of Kubernetes Dashboard.
$ kubectl get pod -n kubernetes-dashboard
NAME                                         READY   STATUS              RESTARTS   AGE
dashboard-metrics-scraper-7b8b58dc8b-ctxzf   0/1     ContainerCreating   0          71s
kubernetes-dashboard-866f987876-qfbvp        0/1     ContainerCreating   0          71s
When the STATUS became RUNNING, run the following command to setup a proxy to access the dashboard.
$ kubectl proxy
Starting to serve on 127.0.0.1:8001
The dashboard can be accessed via url: http://localhost:8001/api/v1/namespaces/kubernetes-dashboard/services/https:kubernetes-dashboard:/proxy/.
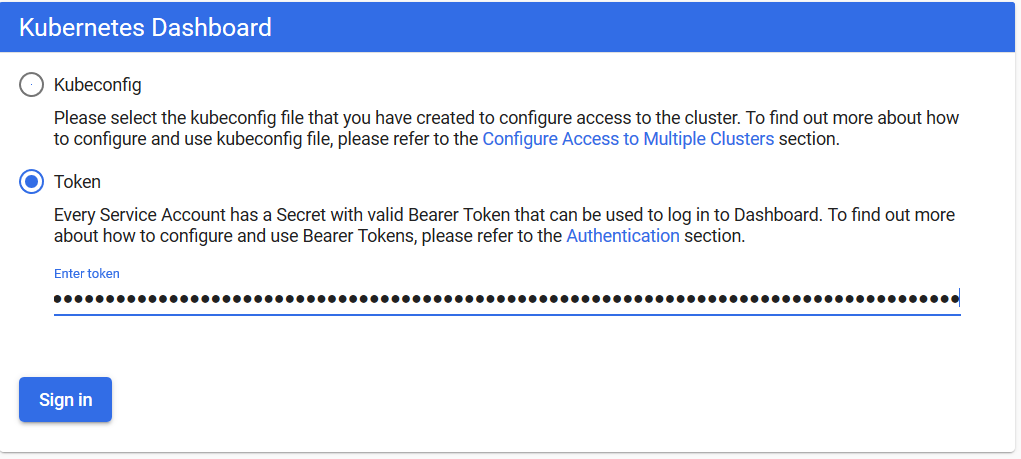
By default, Kubernetes Dashboard requires a token or kubeconfig to access the dashboard page.
$ kubectl -n kubernetes-dashboard get secret
NAME                               TYPE                                  DATA   AGE
default-token-x4j76                kubernetes.io/service-account-token   3      24m
kubernetes-dashboard-certs         Opaque                                0      24m
kubernetes-dashboard-csrf          Opaque                                1      24m
kubernetes-dashboard-key-holder    Opaque                                2      24m
kubernetes-dashboard-token-7656z   kubernetes.io/service-account-token   3      24m

$ kubectl -n kubernetes-dashboard describe secrets kubernetes-dashboard-token-7656z
Name:         kubernetes-dashboard-token-7656z
Namespace:    kubernetes-dashboard
Labels:       <none>
Annotations:  kubernetes.io/service-account.name: kubernetes-dashboard
              kubernetes.io/service-account.uid: 241056aa-7a32-4ed8-8510-5c023bfa4543

Type:  kubernetes.io/service-account-token

Data
====
ca.crt:     1025 bytes
namespace:  20 bytes
token:      eyJhbGciOiJSUzI1NiIsImtpZCI6ImFCUkZNVjRkbTl5TmN6eGlYYXBGSDljMlNTLVIwQ1ZUOU96VzU0RFBwaWsifQ.eyJpc3MiOiJrdWJlcm5ldGVzL3NlcnZpY2VhY2NvdW50Iiwia3ViZXJuZXRlcy5pby9zZXJ2aWNlYWNjb3VudC9uYW1lc3BhY2UiOiJrdWJlcm5ldGVzLWRhc2hib2FyZCIsImt1YmVybmV0ZXMuaW8vc2VydmljZWFjY291bnQvc2VjcmV0Lm5hbWUiOiJrdWJlcm5ldGVzLWRhc2hib2FyZC10b2tlbi03NjU2eiIsImt1YmVybmV0ZXMuaW8vc2VydmljZWFjY291bnQvc2VydmljZS1hY2NvdW50Lm5hbWUiOiJrdWJlcm5ldGVzLWRhc2hib2FyZCIsImt1YmVybmV0ZXMuaW8vc2VydmljZWFjY291bnQvc2VydmljZS1hY2NvdW50LnVpZCI6IjI0MTA1NmFhLTdhMzItNGVkOC04NTEwLTVjMDIzYmZhNDU0MyIsInN1YiI6InN5c3RlbTpzZXJ2aWNlYWNjb3VudDprdWJlcm5ldGVzLWRhc2hib2FyZDprdWJlcm5ldGVzLWRhc2hib2FyZCJ9.OlgYkWDm3ZYd6o6w4vTtFoBcCIfU8cRuJ3Lhh8WDJ7HKd2pYkDpATSBZjrOUndnhyfYc_E1ePvOPeMcU5iy5sMA_Is2uxepDnsMOxVnd7ctV-RHdrk0ZZLCz4Mt0uvuGqGIe9ZfNzPC97fF7RsL_Lz826F-9DNRjWVniPpT3TfzgEB29OXSYVqLjbvDCimtgLd-N0NeIgWdH5MbVwUiJZsBuKsa4A65bkQ6KfzsoaSFFHz8qeEV6AG5e7CGrDUjSHXVWbp6wVj2unC__nxZM8oOF4klgTakTR_TUl5dogTtCoT02sSgMR8iOgs7DPfO4YWFPMNb6nZWefBtT5JzpzA
In the login page, select Token, and copy the above token value to the field Enter token and click Sign in button.
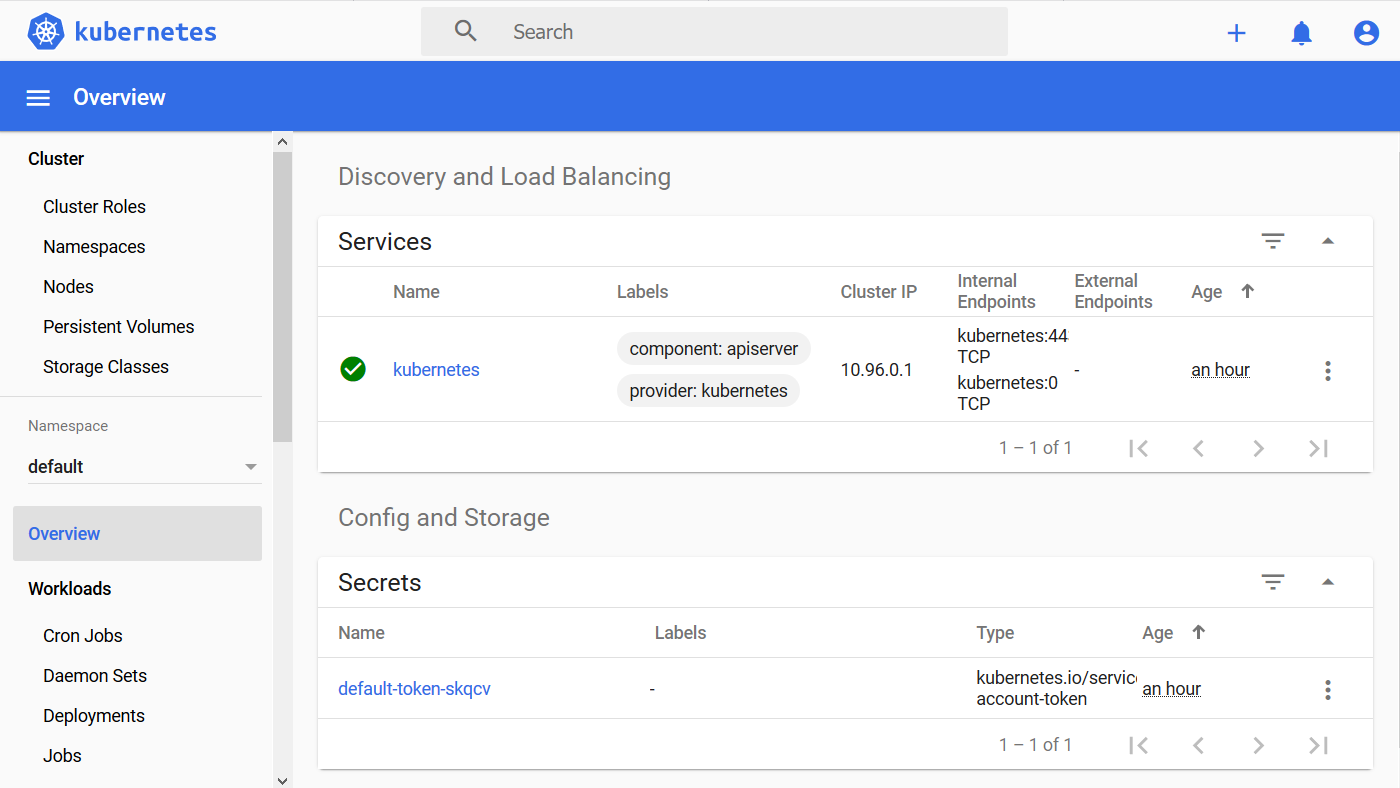
After you are logged in, it shows the Kubernetes Dashboard page for you.
Minikube
Alternatively, you can follow the official Kubernetes guide to install a minikube manually to serve a local Kubernetes cluster.
Once it is installed, run the following command to verify if minikube is installed successfully.
$ minikube version
minikube version: v1.8.1
commit: cbda04cf6bbe65e987ae52bb393c10099ab62014
Start minikube, it will preare a local Kubernetes cluster for you. If this is the first time to run minikube, it will take some time to prepare the environment.
$ minikube start

// Chinese user add --image-repository to avoid issues of accessing goolge service in China.
$  minikube start --driver=hyperv --memory=4096m --image-repository=registry.cn-hangzhou.aliyuncs.com/google_containers
Check minikube status.
$ minikube status
host: Running
kubelet: Running
apiserver: Running
kubeconfig: Configured
Start minikube dashboard.
$ minikube dashboard
* Enabling dashboard ...
* Verifying dashboard health ...
* Launching proxy ...
* Verifying proxy health ...
* Opening http://127.0.0.1:51489/api/v1/namespaces/kubernetes-dashboard/services/http:kubernetes-dashboard:/proxy/ in your default browser...
It will open the default browser automatically and show you the Kubernetes Dashboard page.
Stop minikube.
$ minikube stop
* Stopping "minikube" in hyperv ...
* Powering off "minikube" via SSH ...
* "m01" stopped.
Pause and resume minikube.
$ minikube pause

// resume a paused minikube k8s cluster.
$ minikube unpause
Delete the minikube cluster.
$minikube delete
Deploying on the local Kubernetes cluster
When a local Kubernetes cluster is ready, it is time to deploy our application into this Kubernetes cluster.
Firstly, create a deployment from the docker images we have built.
$ kubectl create deployment jakartaee8-starter --image=hantsy/jakartaee8-starter-wildfly
deployment.apps/jakartaee8-starter created
Check the deployments.
$ kubectl get deployments
NAME                 READY   UP-TO-DATE   AVAILABLE   AGE
jakartaee8-starter   1/1     1            1           40m
To access the jakartaee8-starter Deployment, exposes it as a Service.
$ kubectl expose deployment jakartaee8-starter --type=NodePort --port=8080
service/jakartaee8-starter exposed
Check the exposed services.
$ kubectl get services
NAME                 TYPE        CLUSTER-IP    EXTERNAL-IP   PORT(S)          AGE
jakartaee8-starter   NodePort    10.101.72.8   <none>        8080:32458/TCP   40m
kubernetes           ClusterIP   10.96.0.1     <none>        443/TCP          9h
Check the pod status, it will take some time to create the container.
$ kubectl get pods
NAME                                 READY   STATUS              RESTARTS   AGE
jakartaee8-starter-675889c77-pd7kw   0/1     ContainerCreating   0          3m21s
When the status becomes Running, it is ready for accessing from client.
$ kubectl get pods
NAME                                 READY   STATUS    RESTARTS   AGE
jakartaee8-starter-675889c77-pd7kw   1/1     Running   0          23m
Run the following command to access the sample endpoint inside the pod.
$ kubectl exec -it jakartaee8-starter-675889c77-pd7kw curl localhost:8080/jakartaee8-starter/api/greeting/Hantsy
{"message":"Say Hello to Hantsy at 2020-03-10T16:52:21.332576"}
To access it from external requests, firstly you should get the port of the exposed service.
Use describe command to get the details of the exposed Service. Kubernetes assigned a port to expose the service to external clients, here it is 32458.
$ kubectl describe services/jakartaee8-starter
Name:                     jakartaee8-starter
Namespace:                default
Labels:                   app=jakartaee8-starter
Annotations:              <none>
Selector:                 app=jakartaee8-starter
Type:                     NodePort
IP:                       10.101.72.8
Port:                     <unset>  8080/TCP
TargetPort:               8080/TCP
NodePort:                 <unset>  32458/TCP
Endpoints:                172.17.0.6:8080
Session Affinity:         None
External Traffic Policy:  Cluster
Events:                   <none>
// or get nodePort by go template
$ kubectl get services/jakartaee8-starter -o go-template=''
32458
Get the local K8s cluster ip.
$ minikube ip
172.19.204.81
Now try to send a request to the sample endpoint.
$ curl http://172.19.204.81:32458/jakartaee8-starter/api/greeting/Hantsy
{"message":"Say Hello to Hantsy at 2020-03-10T16:42:23.999636}
Scale deployments.
$ kubectl scale --replicas=2 deployment jakartaee8-starter
deployment.apps/jakartaee8-starter scaled

$ kubectl get pods
NAME                                 READY   STATUS    RESTARTS   AGE
jakartaee8-starter-675889c77-8mngf   1/1     Running   0          37m
jakartaee8-starter-675889c77-p7kl7   1/1     Running   0          48s
Delete resources.
$ kubectl delete service jakartaee8-starter
$ kubectl delete deployment jakartaee8-starter
Simply you can create a Deployment from a defined yaml file.
$ kubectl apply -f .\deployment.yaml
deployment.apps/jakartaee8-starter created
service/jakartaee8-starter created

$ kubectl get pods
NAME                                 READY   STATUS    RESTARTS   AGE
jakartaee8-starter-675889c77-jxdgw   1/1     Running   0          16s

$ kubectl exec -it jakartaee8-starter-675889c77-jxdgw curl http://localhost:8080/jakartaee8-starter/api/greeting/Hantsy

$ kubectl delete -f .\deployment.yaml
deployment.apps "jakartaee8-starter" deleted
service "jakartaee8-starter" deleted
There is a simple approach to generate the yaml template, try to append --dry-run -o yaml to the above kubectl create deployment and kubectl expose depolyment , it will output the yaml format of the Deployment and Service.
The following is a cleaned sample yaml .
apiVersion: apps/v1
kind: Deployment
metadata:
  labels:
    app: jakartaee8-starter
  name: jakartaee8-starter
spec:
  replicas: 1
  selector:
    matchLabels:
      app: jakartaee8-starter
  template:
    metadata:
      labels:
        app: jakartaee8-starter
    spec:
      containers:
      - image: hantsy/jakartaee8-starter-wildfly
        name: jakartaee8-starter-wildfly

---
apiVersion: v1
kind: Service
metadata:
  labels:
    app: jakartaee8-starter
  name: jakartaee8-starter
spec:
  ports:
  - port: 8080
    protocol: TCP
    targetPort: 8080
  selector:
    app: jakartaee8-starter
  type: NodePort
Deploying on OpenShift Online
OpenShift is a leading Kubernetes container platform brought by Redhat. OpenShift provides a 60-days community-support free starter plan for developers.
Open your browse, navigate to https://www.openshift.com/ , click the FREE TRIAL, and click Try it in the Cloud to register OpenShift Online. Wait some minutes, it will take some time to prepare your environment.
When it is ready, sign in to https://www.openshift.com/, it will open up OpenShift Console.
In the console, click create project button to create a new project.
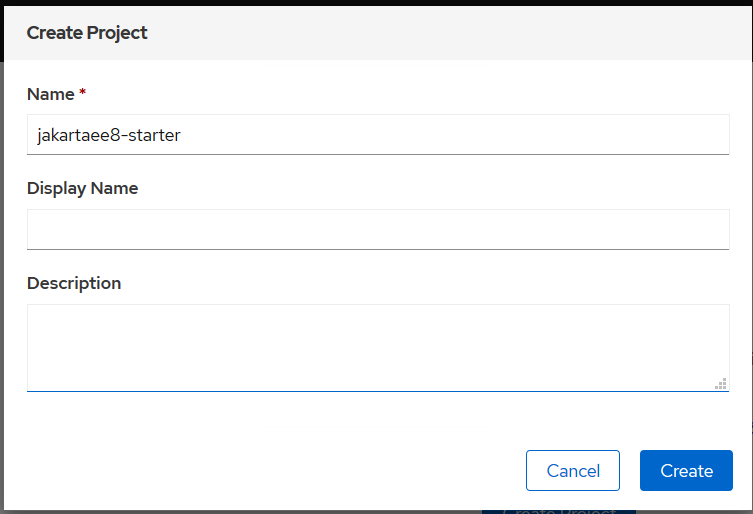
Input project name and click Create button.
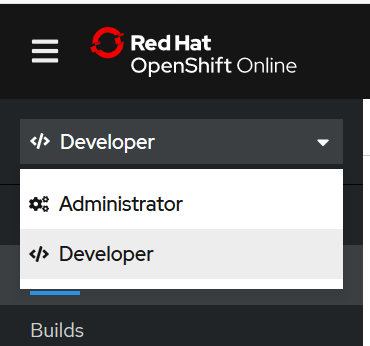
Switch to Developer view.
Click +Add tab, and select Container Image.
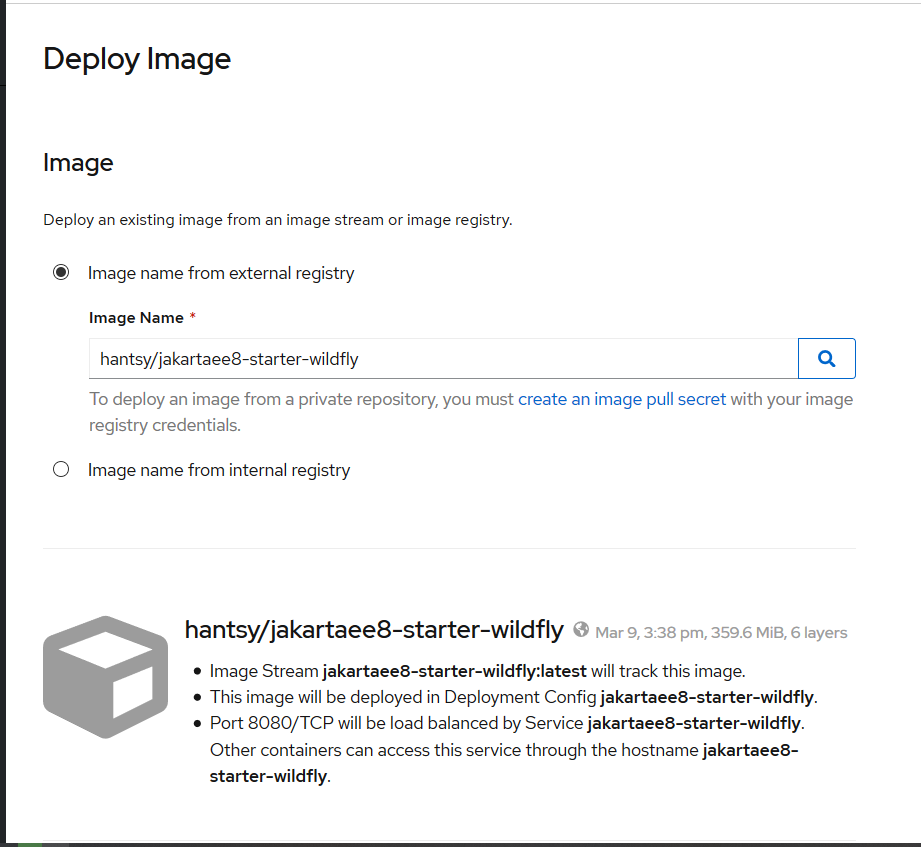
Pull down the page, as you see, the application name and name is set by default, and make sure Create a route to the application checkbox is checked.

Click Create button to finish the form.
It will show a page to display the application status.
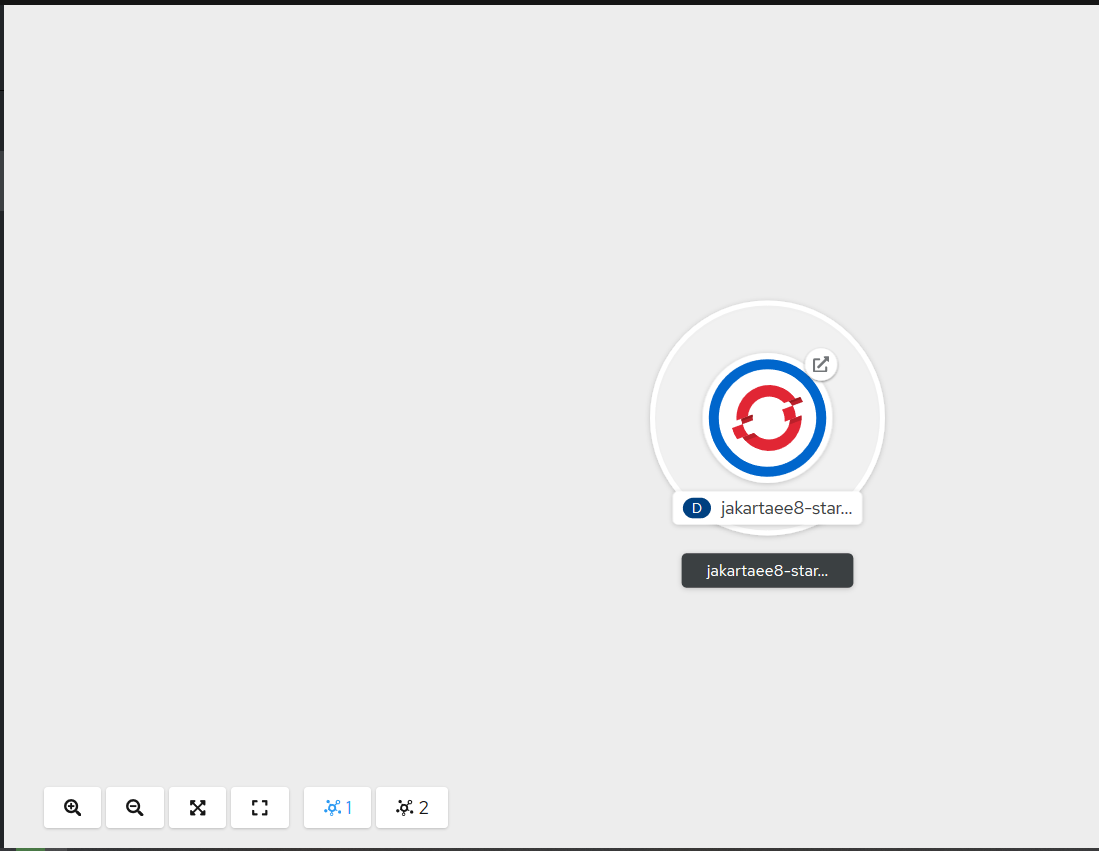
Click the icon of the core of the circle, it will popup a view to display the defailts of the application.
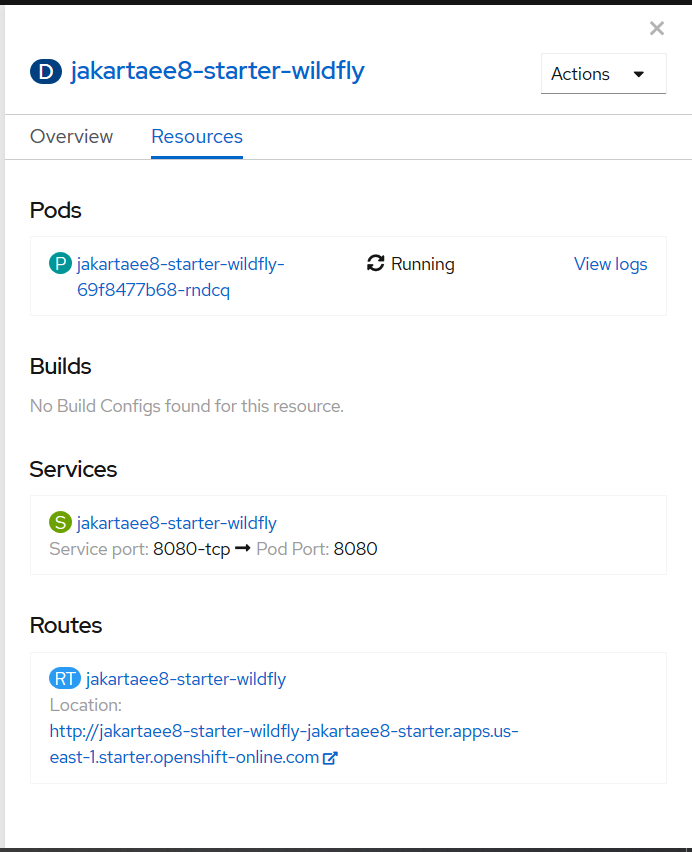
In the bottom of this view, copy the external link of this application.
Open a terminal, run the following command to test the sample enpoint.
$ curl http://jakartaee8-starter-wildfly-jakartaee8-starter.apps.us-east-1.starter.openshift-online.com/jakartaee8-starter/api/greeting/Hantsy
{"message":"Say Hello to Hantsy at 2020-03-10T11:17:31.275764"}
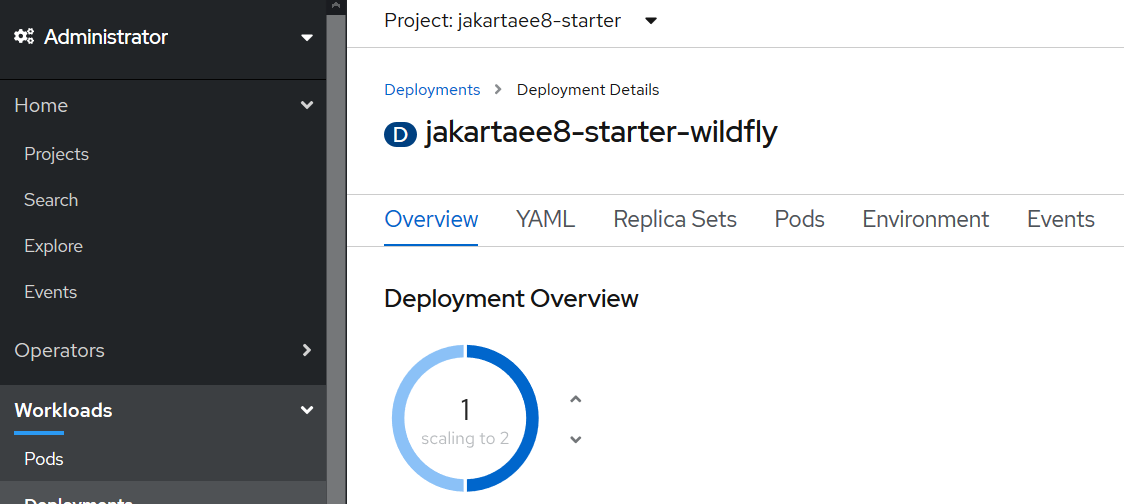
It is easy to scale your deployments in the OpenShift Console.
Switch to Administration mode, and click the Workloads/Deployments tab.
Click jakartaee8-starter-wildfly in the deployments list.
Click the Up icon to scale to deployments to 2 pods.
Click Pods tab in the page, you will find there are 2 pods are running.
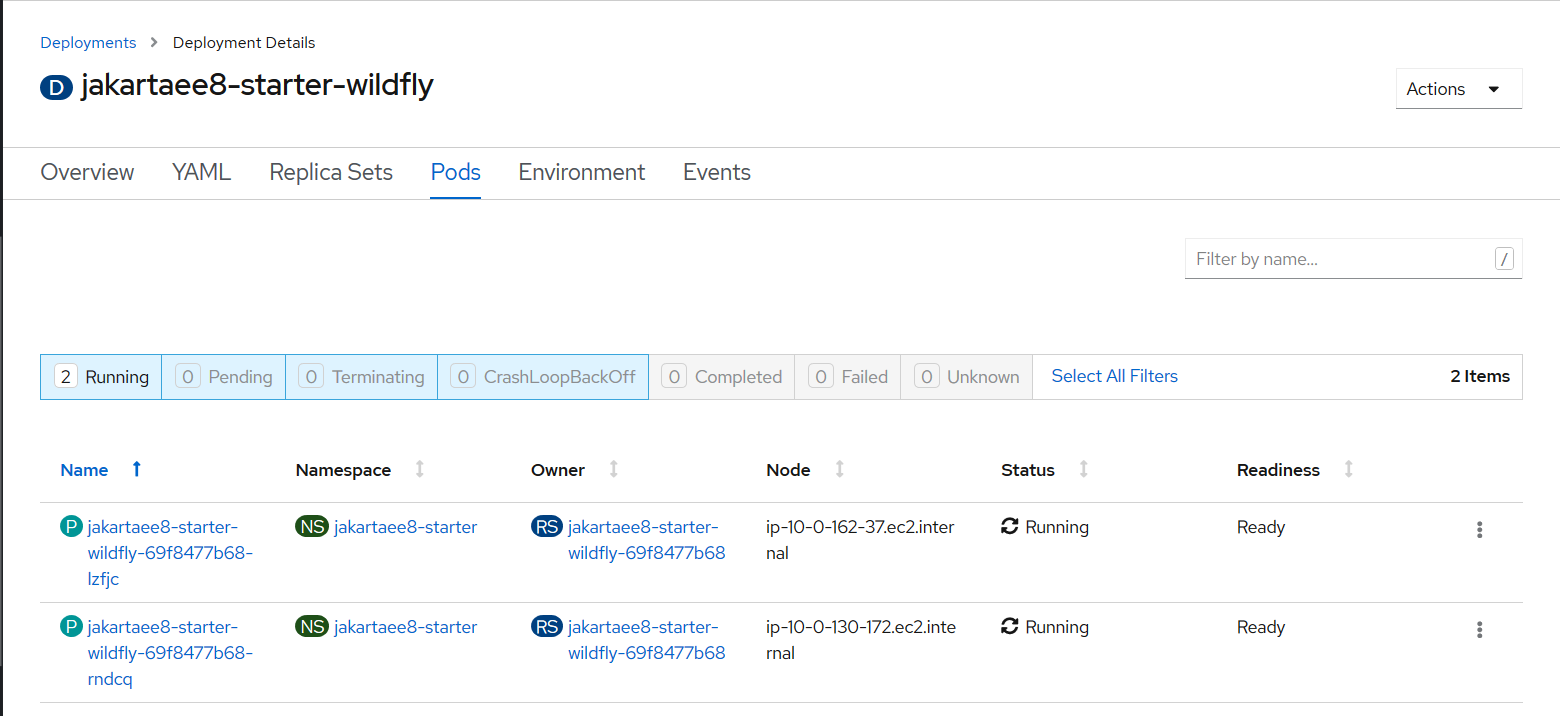
To decrease the number of the pods. Switch the Overview tab, click Down icon. If you click Pods tab again, you will see the status of one pod becomes Terminating and finally removed from this page.